
The short of it… we’re opening up our Atlan Grid API for teams everywhere! 🎉
We’re making it easier for teams everywhere to access the data they need, when they need it. Think minutes, not months.
With the API, you can enrich your understanding of any entity—customers, outlets or geographies—by accessing indicators such as affluence, demographics and more. All updated and granular down to a building level!
All you need to do is request an API key and start experimenting. Get started here.
Now for the entire story… how did we get here?
As you may know, we started as a data team ourselves—working on large-scale projects in emerging markets. As we got our hands dirty project by project, we realized that we were facing the same challenges when it came to external data.
For instance, for one project, we had to map actual sales figures against the total population in an area to find areas of untapped potential. For another, we had to estimate income levels to create better market segments, and for yet another—we were looking for points of interest data on the locations of banks to create a location potential index. Every time we faced the same challenges—alternative data was difficult to find and access. 😣
That’s when we began to realize that data teams everywhere struggled to get access to the right data at the right time.
From the time that I start searching for data, finding the right vendors, testing samples, going through the legal and finance process—it takes 6 months to get access to data!”
A Product Manager in a leading startup
At Atlan, we’ve made it our lives’ mission to democratize data for teams around the world. This includes access to alternative data. For the past few years, our team has been hard at work—aggregating data from 600+ sources, including satellite imagery, public data and building data partnerships—to help teams get access to the data they need at their fingertips.
Today, we’re taking one step further in our vision by launching the Atlan Grid API.
We’re making it even easier for teams everywhere to understand the alternative data available with us and quickly experiment with it through a free trial. In short, we’re helping you leverage alternative data in minutes.
Check out the API and sign up for a free trial here.
So… what can you do with the Atlan Grid API?
You can use the Atlan Grid API to enrich your understanding of any entity—customers, outlets or geographies—by getting easy access to data such as affluence, demographics, movement of people, family type, distance to the closest grocery store or gym, and more in a matter of minutes.
What’s more, you can access data at an extremely granular level—in some cases down to the exact building your customer lives in, and in others down to a 0.8 sq km radius around them, but always at least 10 times more granular than traditional ward-level data. This helps you make more targeted decisions for your business and get better returns on money spent on sales, marketing or other activities. And of course, all our data is updated as of 2019. 😎
We’re launching three types of APIs today.
1. Customer Enrichment API
Want to know which customers are most likely to upgrade to a premium service? All you need to do is enter the home location (latitude-longitude) of your customers and voila! You will get a list of the attributes for your customers (such as income, age and gender, and spending potential) that’ll help you find your top potential customers.
2. Geography Enrichment API
Don’t know enough about the territory that you operate in? We understand. That’s why we’ve spent months mapping evolving city boundaries and shifting rural-urban landscapes. All you need to do is enter your location of interest to get insights on its geographic definition—whether it’s urban or rural, or which pincode, district, town or village it lies in!
3. Unbundled Data API
Want to plug-and-play with the attributes that matter to you? With the Unbundled Data API, you can select only the factors you care about—whether it’s affluence, traffic or proximity to your store.

What makes Atlan Grid different?
1. Get data you can trust
We know that trust is everything when it comes to data. That’s why we make sure all our data goes through a series of checks and validations before you ever see it.
Here’s what makes our data trustworthy:
Diverse data sources from government schemes to satellite imagery
Our data sources go beyond the conventional (like Census data) and integrate everything from satellite imagery to government scheme databases. How did we know this was the way to go? Well, it’s an interesting story…
- For one of our customers, we had to create custom estimates of residential population at a low geographic granularity—the only alternative was to use Census 2011 data, which was outdated and not granular enough.
- To create these estimates, we used inputs on fertility, mortality, migration and more, updated at an annual frequency. But to make things more granular, we decided to tap into satellite data! 🛰️
- We were able to get granular images of the earth down to 10m x 10m that allowed us to detect variables like the number and height of buildings, and electricity consumption at night to arrive at a final population number.
- Our final measure was 10 times more granular than the Census and is updated as of 2019.
Fun fact: As of date, we have processed more than 150,000 satellite images and parsed more than 100,000 PDFs! 💪
Robust data cleaning
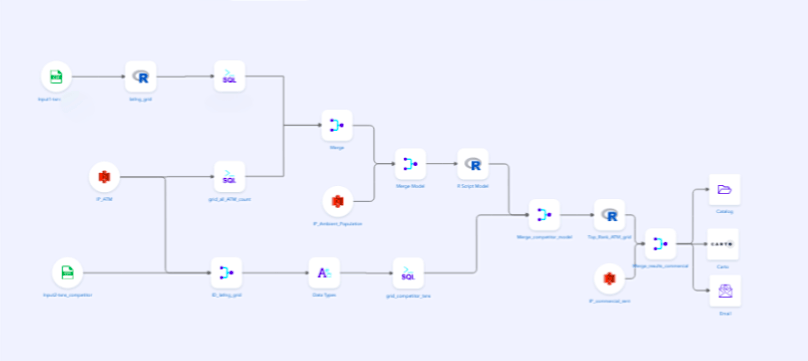
We make sure no bad data touches our models or computations (a Herculean task!). Each indicator goes through a series of cleaning steps ranging from the imputation of missing values, to scale regularization and entity enrichment. What you get is clean and structured data!
Humans and machines work better together
Once the data is clean, our team of data scientists and economists use ML models such as neural nets to create proprietary indices, forecasts and more—creating final indicators that you can call via our API.
This is when the magic begins and machine intelligence is truly complemented by human intelligence, as we start refining ML models to reflect the ground reality.
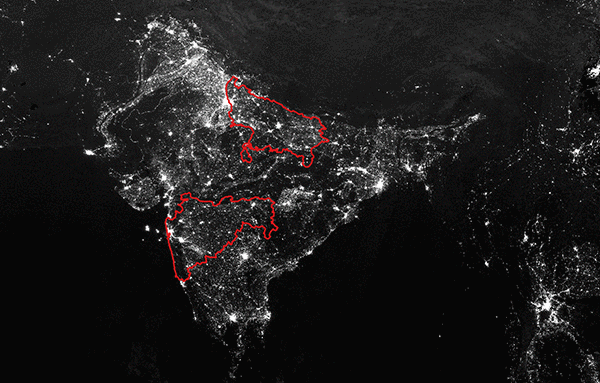
- For instance, we’ve trained our Affluence indicator model to treat the height of buildings in Mumbai (famous for its skyscrapers), differently than those in the Indian capital of Delhi (where buildings are relatively flat). Similarly, our models can differentiate between forests and the lush greenery amid cities—something that the southern Indian state of Kerala is famous for.
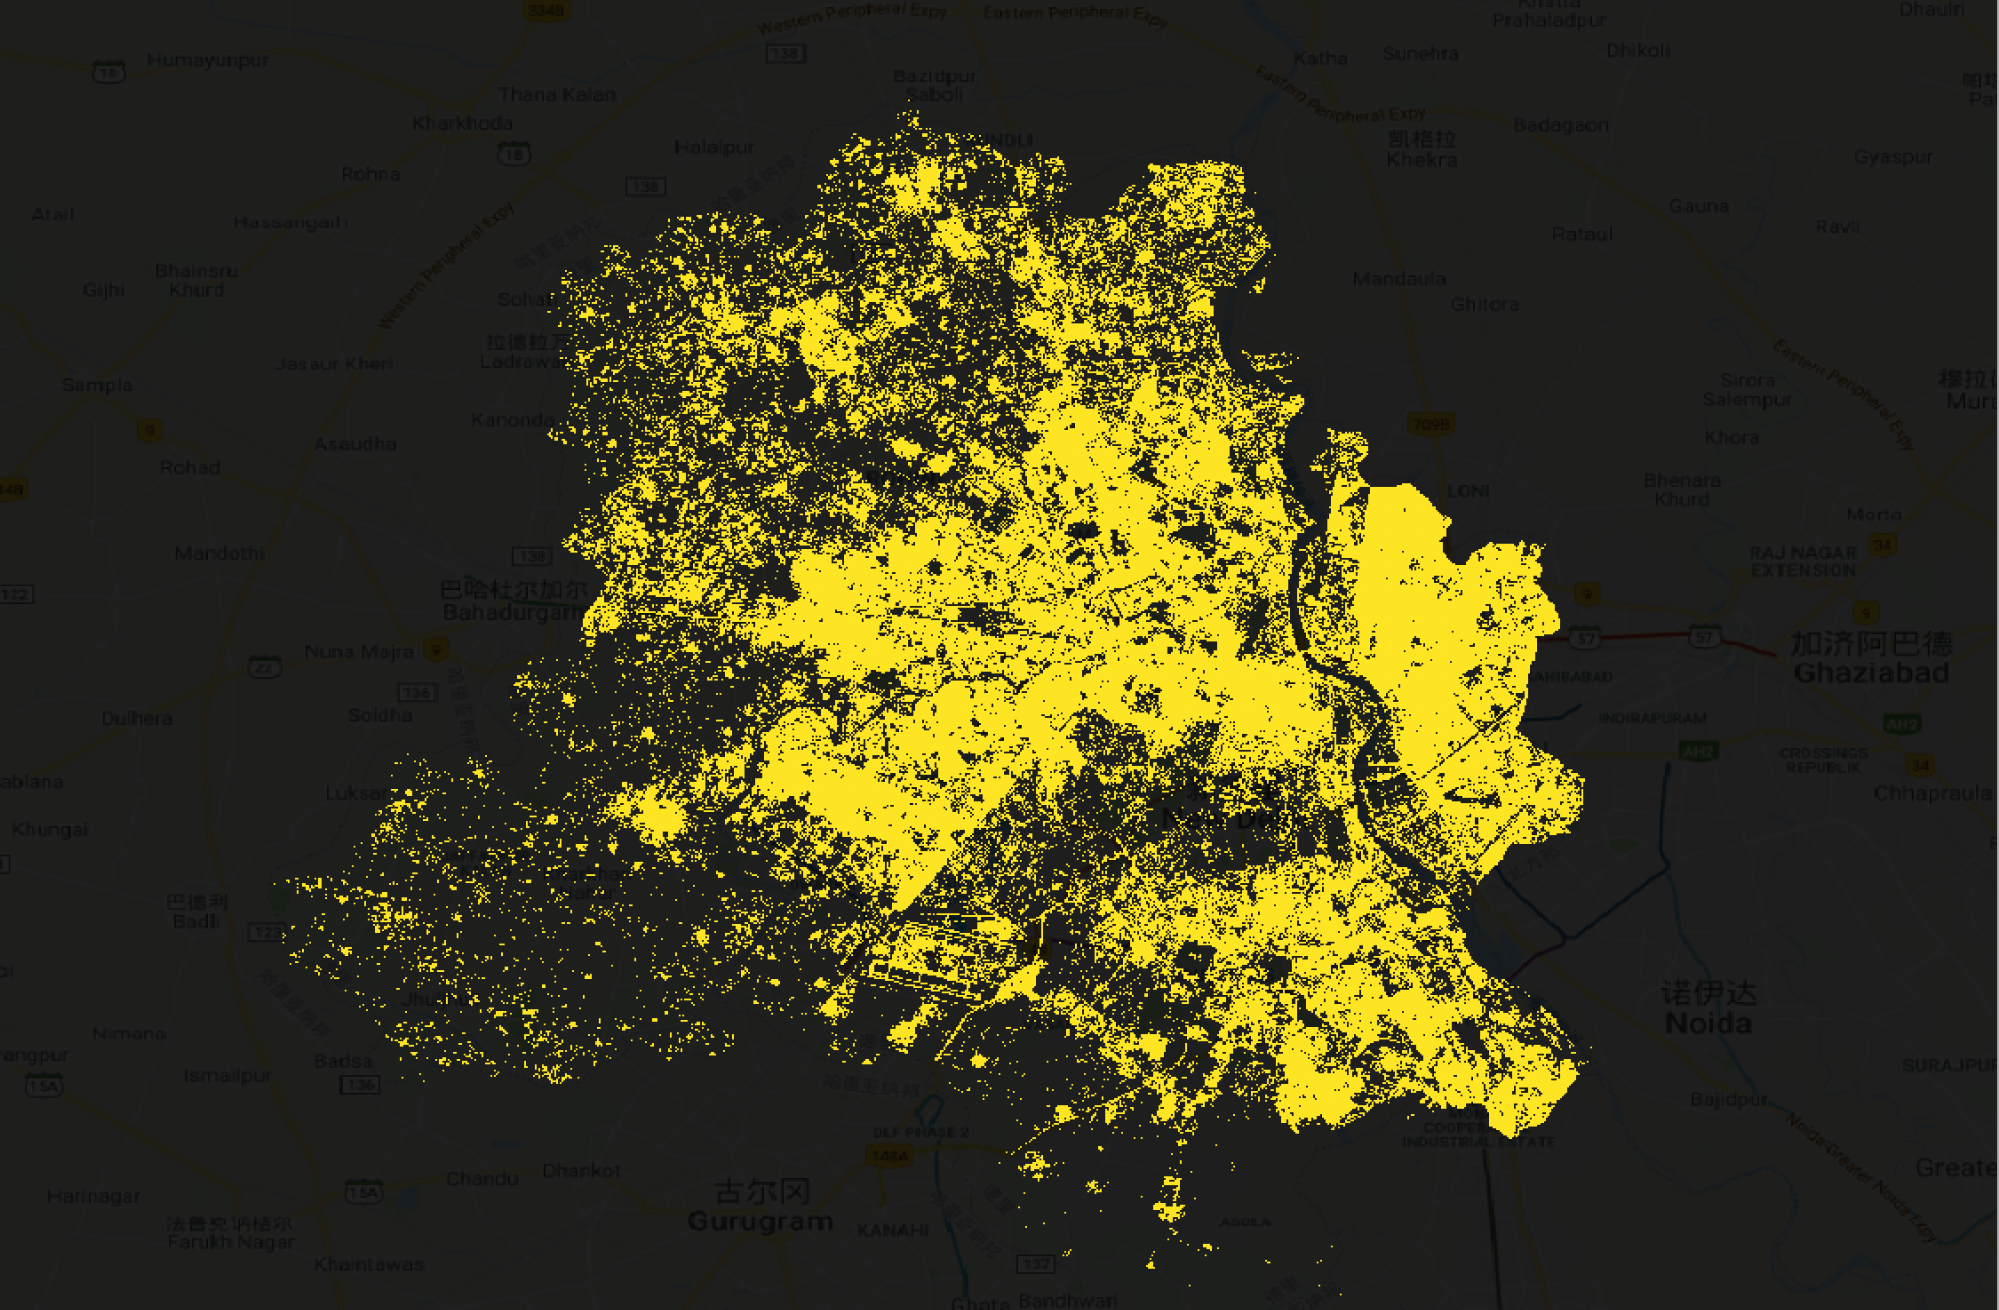
Fun fact: Our land classification model went a little crazy when we were scaling it for Delhi. It was detecting more greenery than there actually was. The aerosol in the air created a layer of haze, which confused the model. We had to cluster high pollution zones like Delhi and Kanpur, and manually build training data for these zones to ensure accurate land classification.
Validated by our beta customers on the ground
Nothing beats on-ground testing when it comes to improving the accuracy of data. Luckily, we have worked with organizations that have incredible reach in India—including top CPG companies, banks and NBFCs, auto manufacturers, and oil companies, besides the Government of India itself!
These organizations have been our beta customers, helping us validate our data with their large field teams spread across the country. Their feedback has been truly invaluable and helped us adjust our algorithms and finalize our methodology.
Real-world success and outcomes
We’re happy to share that our customers have successfully used our data to activate their sales, distribution and marketing strategies and are winning in the market!
Our measure of income and prosperity has proven to be directly proportional to the sales of leading CPG companies, while our economic growth metric has helped automotive leaders achieve a 2.4x increase in marketing inquiries.
See how our indicators can help you too.
2. Move fast and stay agile
In today’s rapidly evolving business world, we understand the need to move fast. If a data scientist wastes 6-9 months on getting access to the data they need, their company will struggle to maintain the cutting edge required to stay relevant.
To reduce this lag and help your team focus on the things that matter, we do the heavy lifting for you—from acquisition, to cleaning and structuring, and compliance to legal and privacy standards.
Today, we’re taking our vision one step further by making it easy for the humans of data to access the information they need by launching the Atlan Grid API. No more demo forms on websites and evaluation call with data providers. Now you can simply request access to an API key and get started with experimenting with alternative data. 🚀
Ready to explore our data? You can experiment with our key indicators in a sandbox environment for the city of Bengaluru, India. Go here
If you’re not interested in Bengaluru but would like to use our API for another city, please get in touch with us at [email protected].
3. Innovate and stay ahead of the competition
The financial industry—hedge funds, banks
But others have not been too far behind. Walmart used weather data to predict demand for its Pop-Tarts, increasing its inventory to seven times before a storm to meet a surge in demand.
We’re making it easy for teams across sectors to drive innovation using alternative data via the Atlan Grid API—a simple yet powerful way to access accurate, updated information.
Our customers are already winning with Atlan Grid!
In only 18 months, Atlan has helped data teams generate exceptional business results. 🏆
19% sales lift
Unilever’s Lifebuoy team used Atlan Grid’s weekly data on infectious diseases to target 150 million alerts in areas with active breakouts. They achieved 19% sales growth, 2.2% market penetration expansion and even won two Lions at Cannes 2019!
14 million USD in incremental revenue
A large manufacturing company used Atlan Grid’s economic potential measures to find untapped markets—and delivered 14 million USD in new revenue within 3 months.
Better credit scoring
In a country where two-thirds of our citizens have no credit score and many others have thin credit histories, Atlan Grid data is providing a valuable lift to credit scoring models.
Granular customer segmentation
For a digital advertising use case, Atlan Grid data was used to segment audiences by affluence and income, increasing click-through rates. It pays to show the right ad to the right user!
Check out our Atlan Grid API now and get all the data you need, when you need it!
Questions? Please feel free to write to us at [email protected] or leave a comment below.


