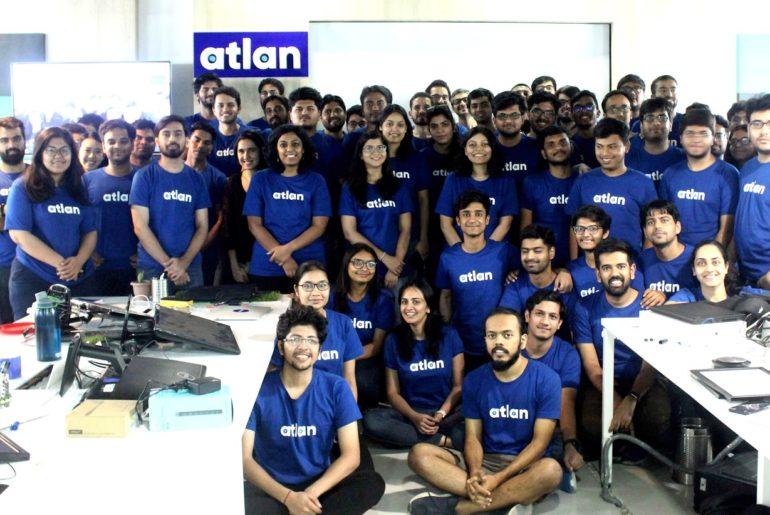
Our week just got off to a brilliant start as we joined the third batch of Surge, a program by Sequoia Capital for rapidly scaling startups. Sequoia Capital has helped build leading global enterprises, from idea to IPO and beyond. They have backed the world’s most legendary #FutureofWork tools — Zoom, Github, Loom, Figma – and now, Atlan!Prukalpa Sankar, co-founder…
Who’s a happy startup? We are! All thanks to Analytics India Magazine (AIM), as they featured Atlan as one of the 10 emerging data and analytics startups in India in 2020. 🎉 Here’s what the magazine had to say: Atlan’s data workspace helps bring reproducibility to data and analytics assets, with easily shareable data profiles, metadata and documentation, project templates, and…
Appreciation is a great way of making someone’s day. And thanks to appreciation from Singapore Business Review (SBR), our week started on a high note. Why, you ask? They featured Atlan as one of the 20 hottest startups in Singapore. 🥳 Trends in VC funding as per Singapore Business Review The ninth edition of the report starts by mentioning three…
We’re so excited to announce the launch of our second online course about geospatial data in R. Sign up here. When you hear “geospatial data”, what comes to your mind? For many people, it’s ordinary maps. These are an important output of geospatial data, but it can actually be used for so much more. Geospatial data is at the heart…
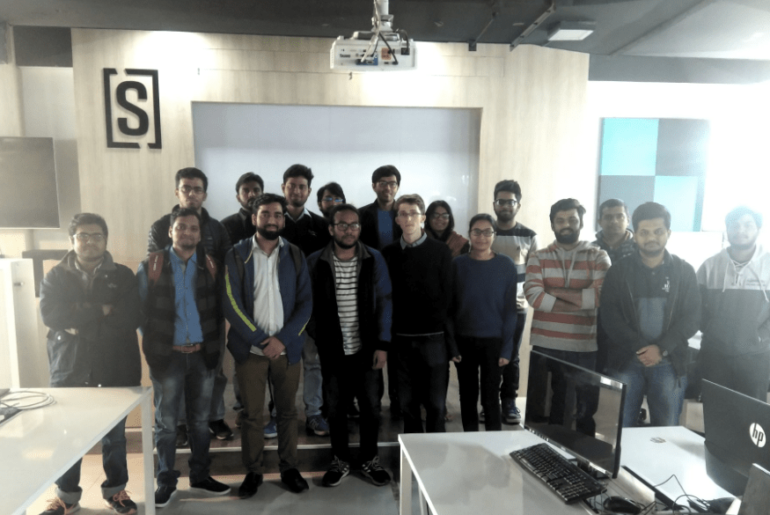
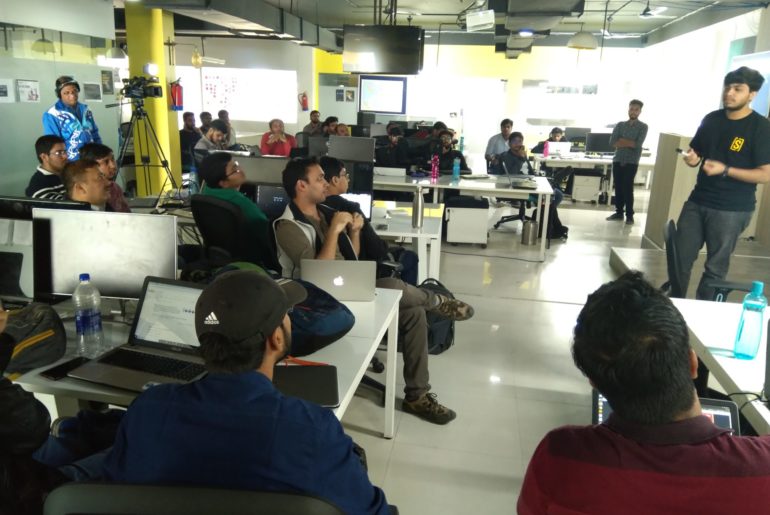
Earlier this year in July, we hosted the first ever Delhi useR meetup in collaboration with the Delhi useR Group and R Consortium. We also had a chance to host a member of R-Core, creator of the lattice package, professor Deepayan Sarkar from the Indian Statistical Institute. You can watch the talks from the last meetup on our YouTube channel…
The technology community today is very different than what it was a decade ago. With more and more focus on shared learning today, we are driven by collaborative projects and open source contributions. We are fortunate to witness this firsthand while hosting events that bring together fellow technologists, data enthusiasts, developers, and engineers from across Delhi NCR through Atlan Community…
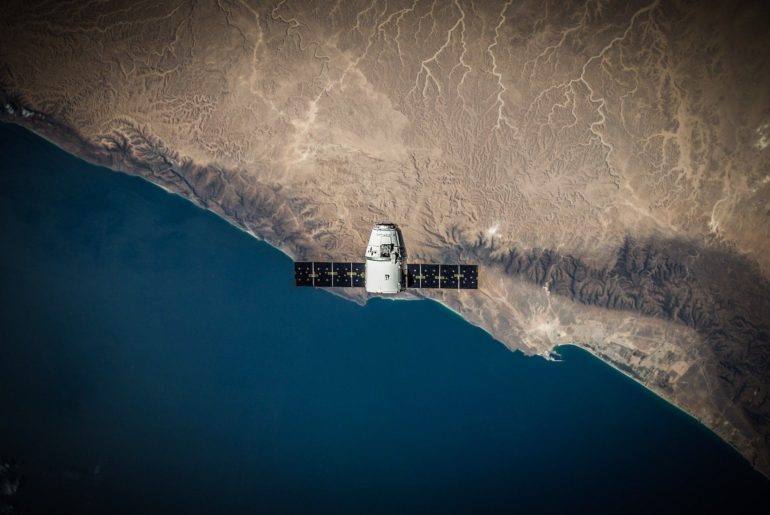
Landsat is without a doubt one of the best sources of free satellite data today. Managed by NASA and the United States Geological Survey, the Landsat satellites have been capturing multi-spectral imagery for over 40 years. The latest satellite, Landsat 8, orbits the Earth every 16 days and captures more than 700 satellite images per day across 9 spectral bands…
Imagine that you have a room filled with dozens of sleeping cats, and you want to know how many cats there are. It would also be good to know some basic insights about your new cat colony — for example, what colors the cats are and whether any of them have extra long tails. This doesn’t seem too difficult, right?…
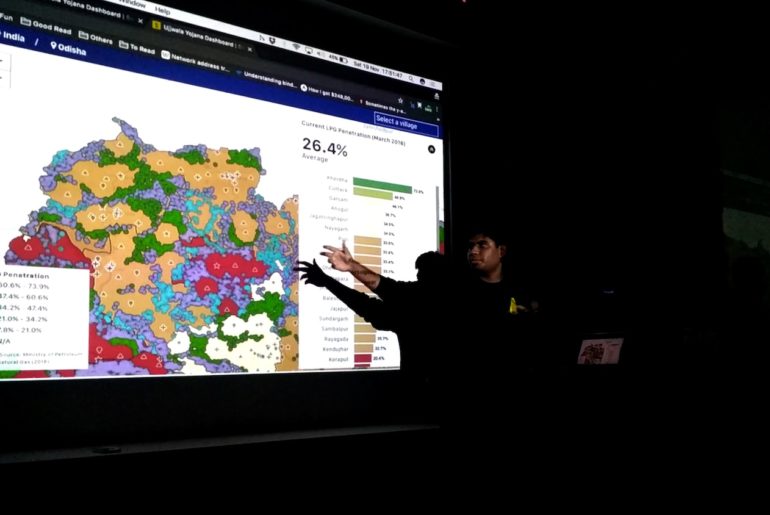
Data visualization and visual analytics is one of the fastest growing disciplines in today’s increasingly data-driven world. With use cases spread across diverse domains — healthcare, policy, sports, governance, journalism, and more — data visualization is being used extensively by decision-makers to make important decisions in a fraction of seconds. After all, the story behind the numbers reveals far greater…
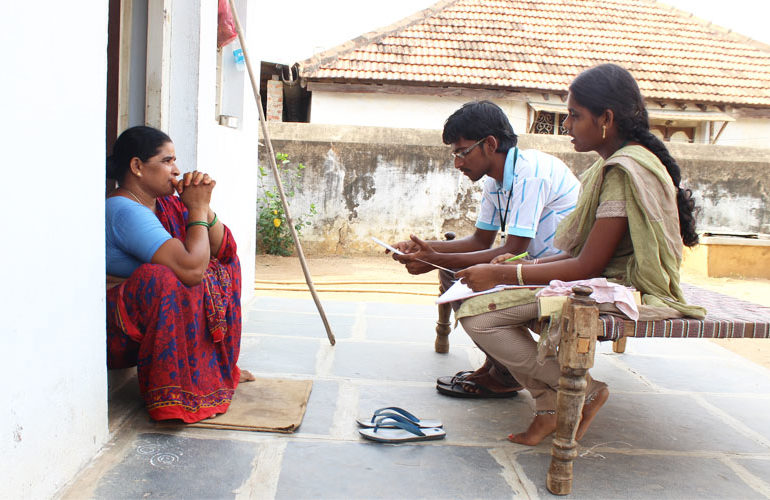
We’re excited to announce that we published a free ebook about data collection! Data has become fundamental in nearly every aspect of life, and all types of companies — from large technology companies to small rural nonprofits — are collecting data on their work. Surveys are an indispensable tool for data collection, but they are not simple to create. A…

